The Clean Streams in Southern Sonoma County (CS3C) project, funded by the US EPA, addresses associated water quality monitoring and pollutant source-tracking needs. Since 2015, Sonoma Ecology Center (SEC) has partnered with Sonoma County’s Permit and Resource Management Department (Permit Sonoma) to complete seasonal water quality assessments.
The purpose of this water quality monitoring is to increase understanding of variability in, and sources of potential pollutants within the target watershed. Water sample collection points, located on public-access lands, were selected based on existing long-term monitoring sites and geographical gaps in the sampling locations, as well as areas with consistent higher values for pathogen indicators.
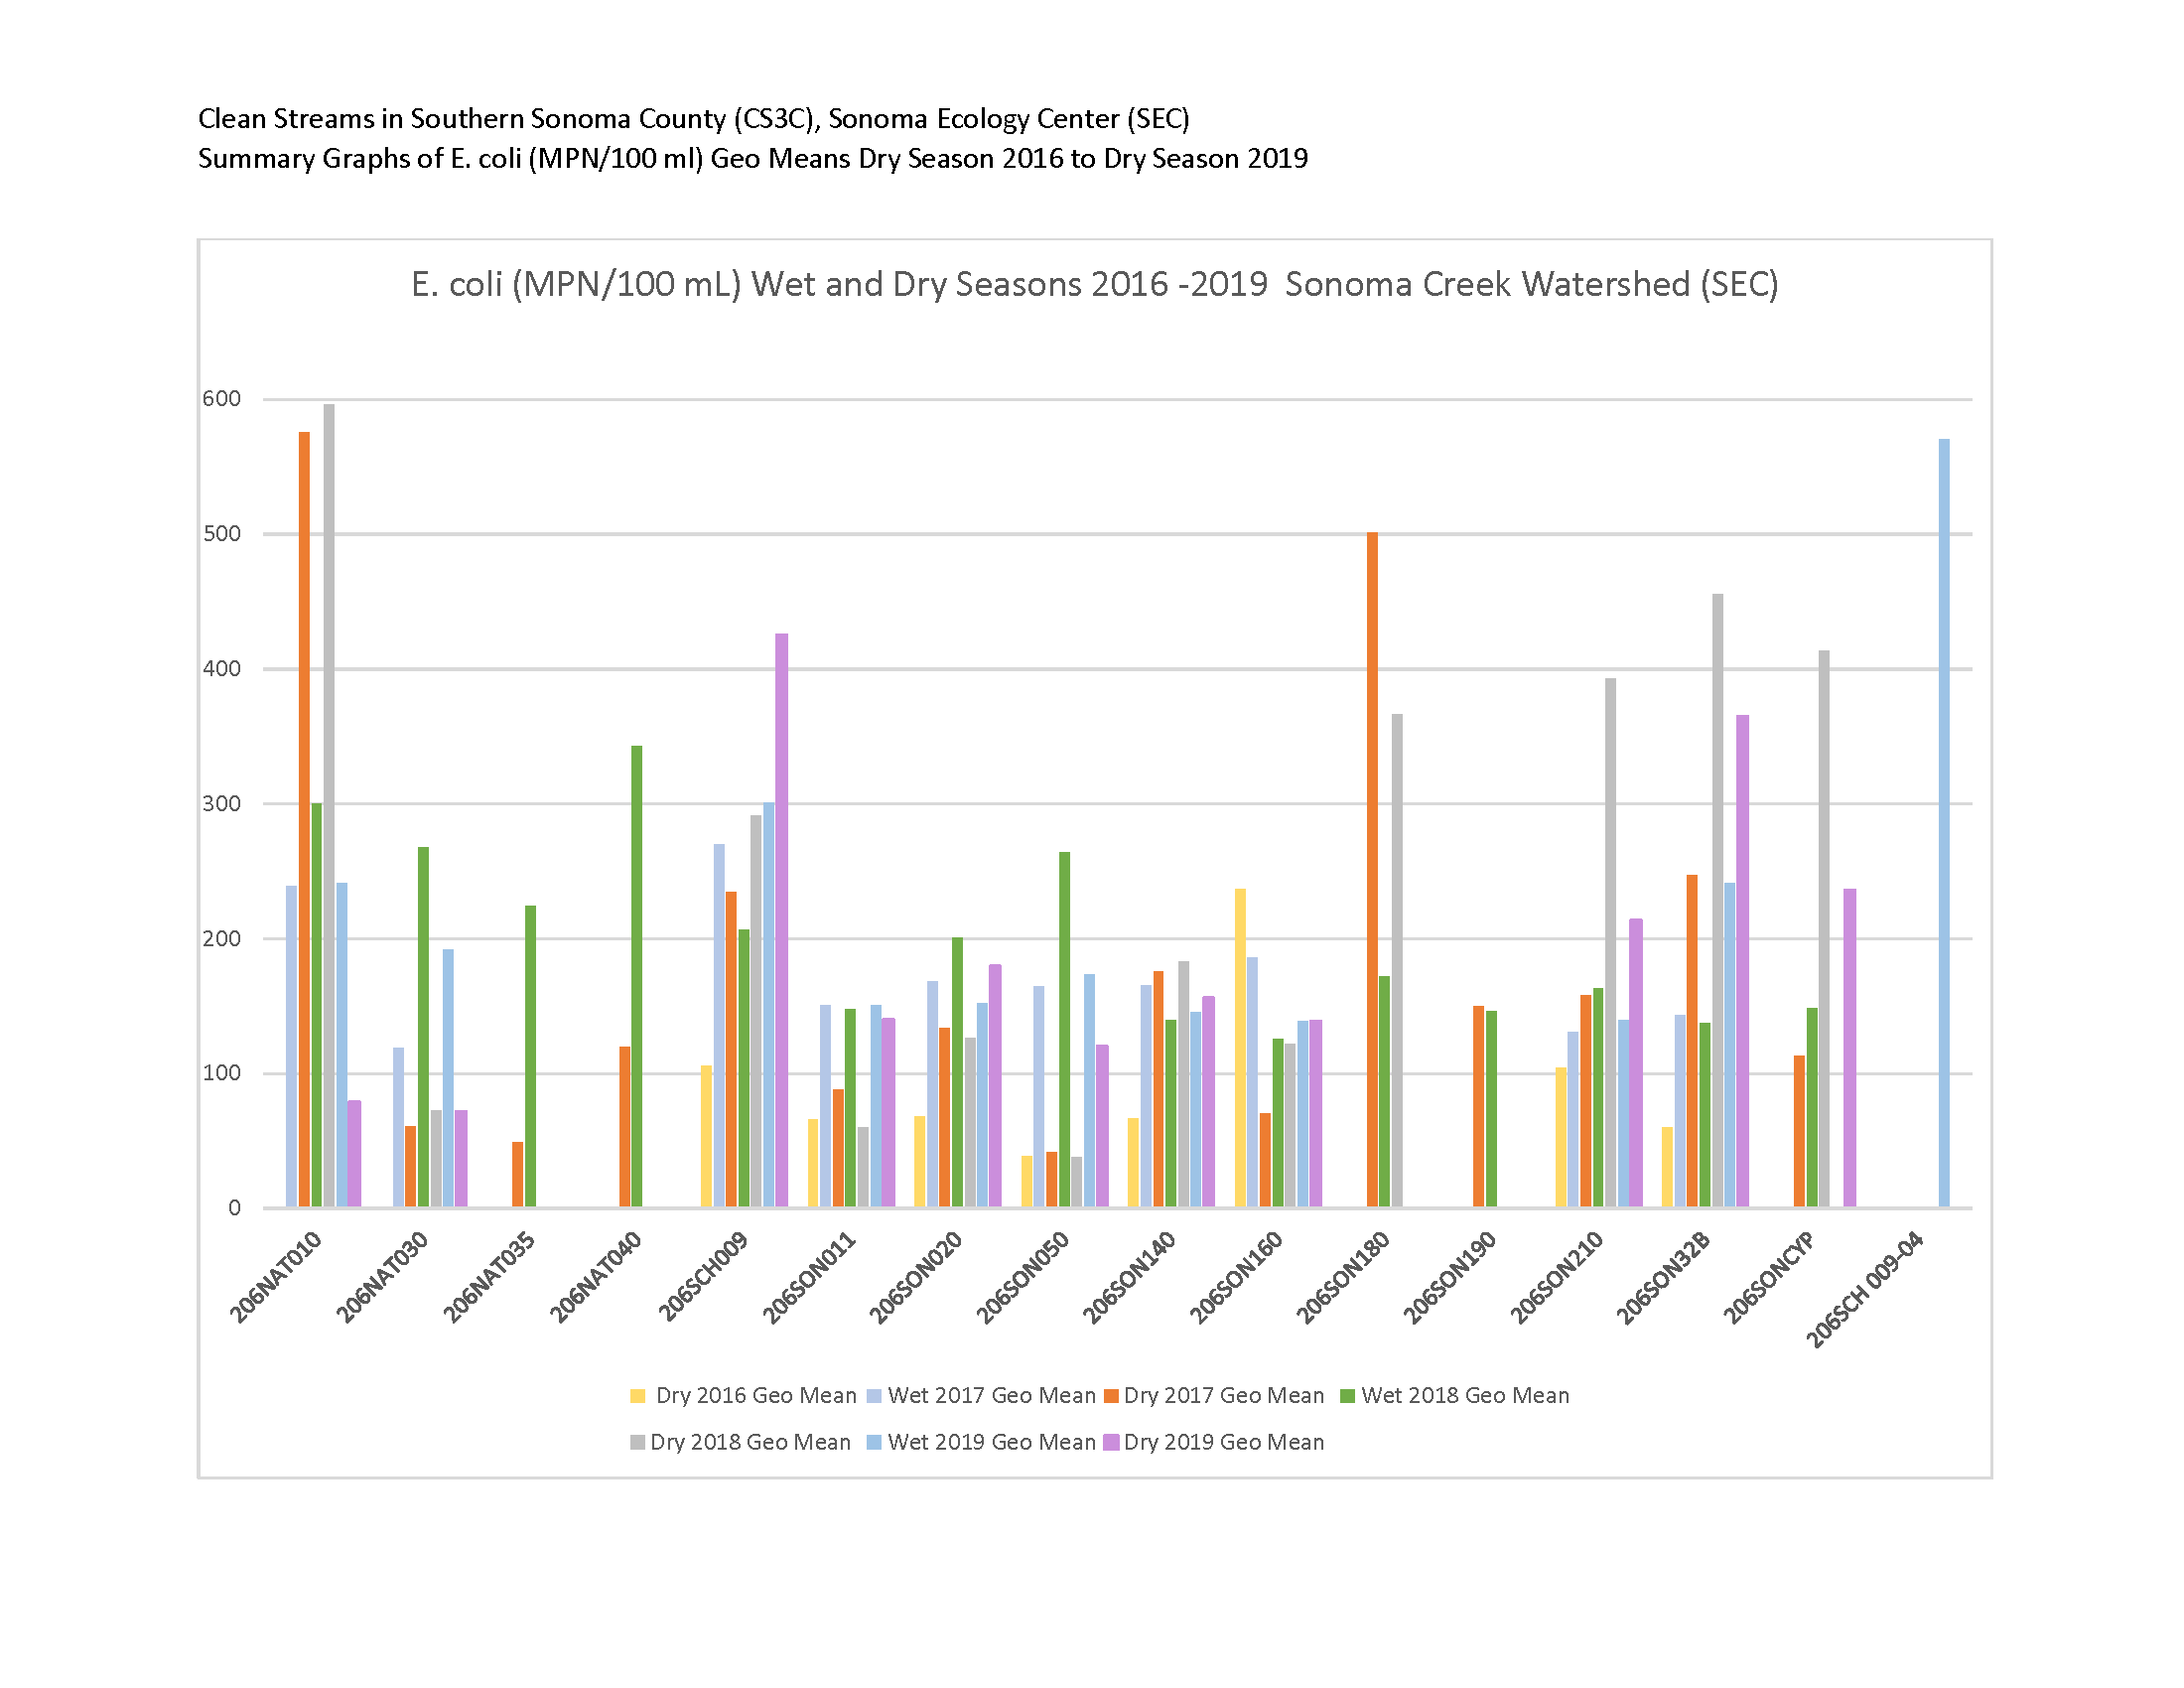
This effort specifically targets measuring pathogens (such as E. coli) and pesticides appearing in local streams. In addition to pathogens and pesticides, standard water quality and environmental variables (e.g. air and water temperatures, weather, dissolved oxygen) are also collected at each site.
The pathogen sample area encompasses the majority of the Sonoma Valley watershed. Pesticide sampling sites are in and around the City of Sonoma and the City of Petaluma.
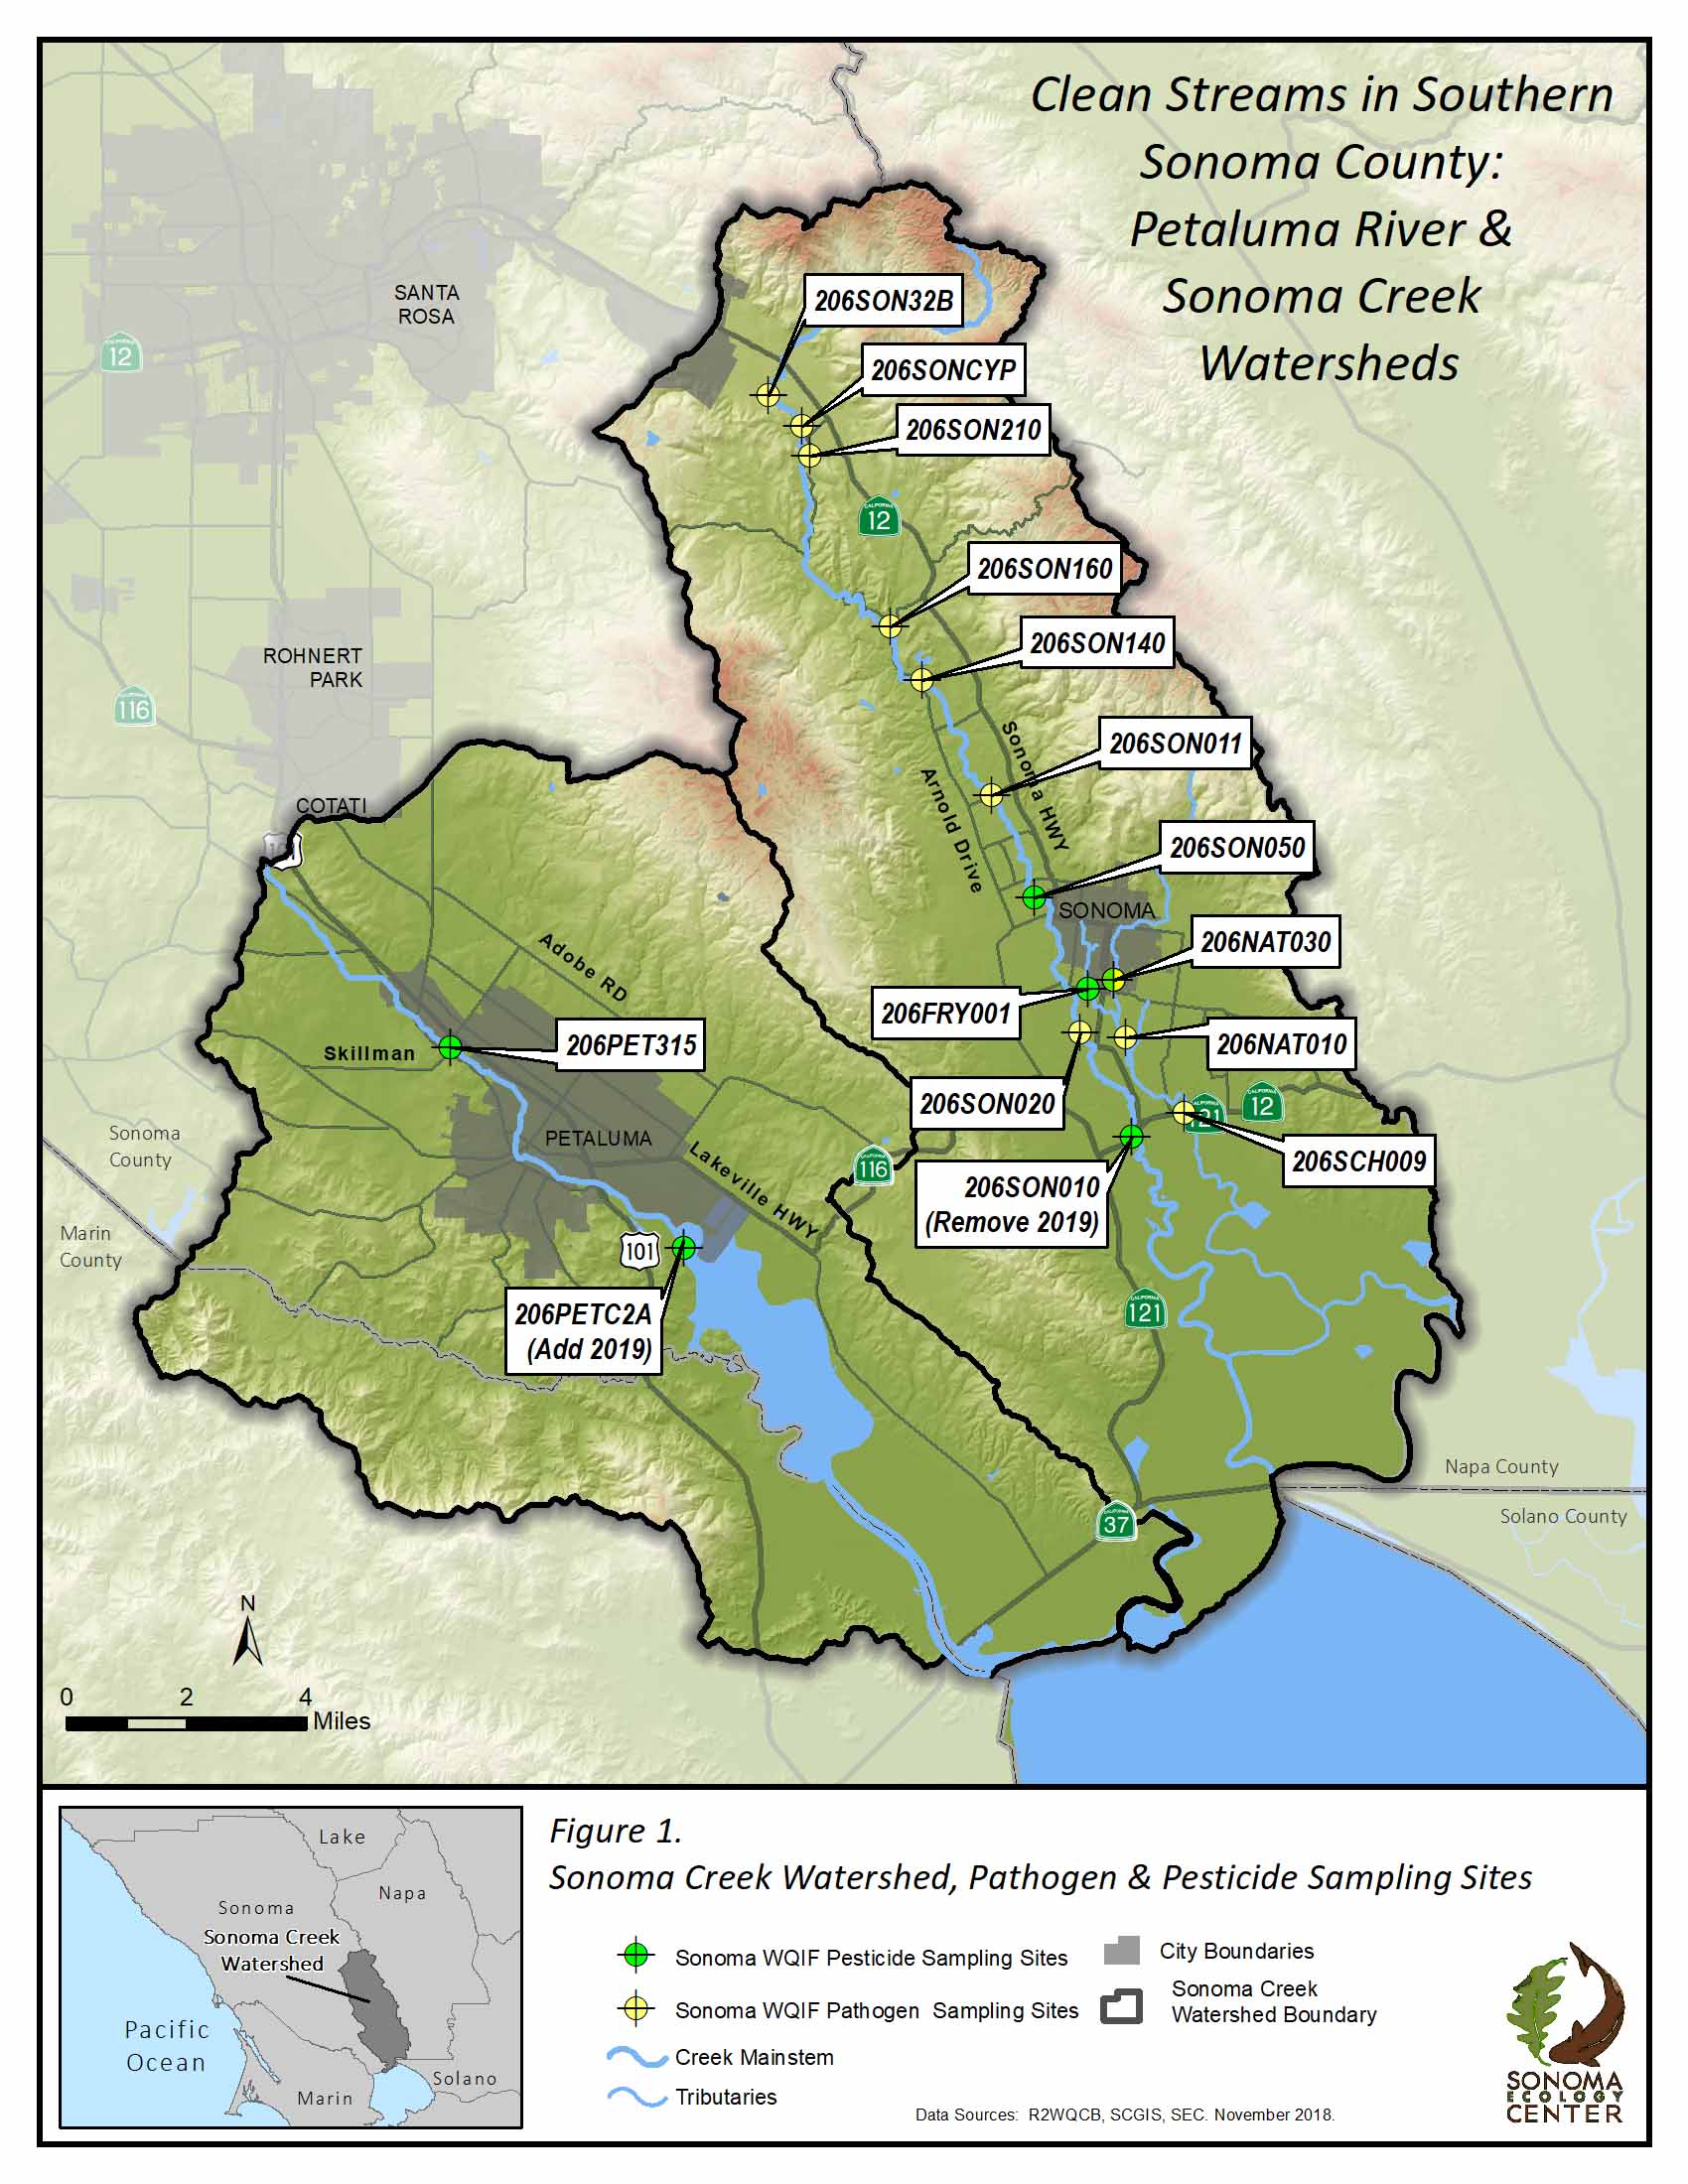
2019 SEC CS3C Pesticide and Pathogen Monitoring Cores Sites
Pathogen samples are collected in the wet season (December to March) and dry season (June to August). Wet season pathogen sampling is storm-event based with pathogen samples collected during 2-3 storms, spanning winter and spring. 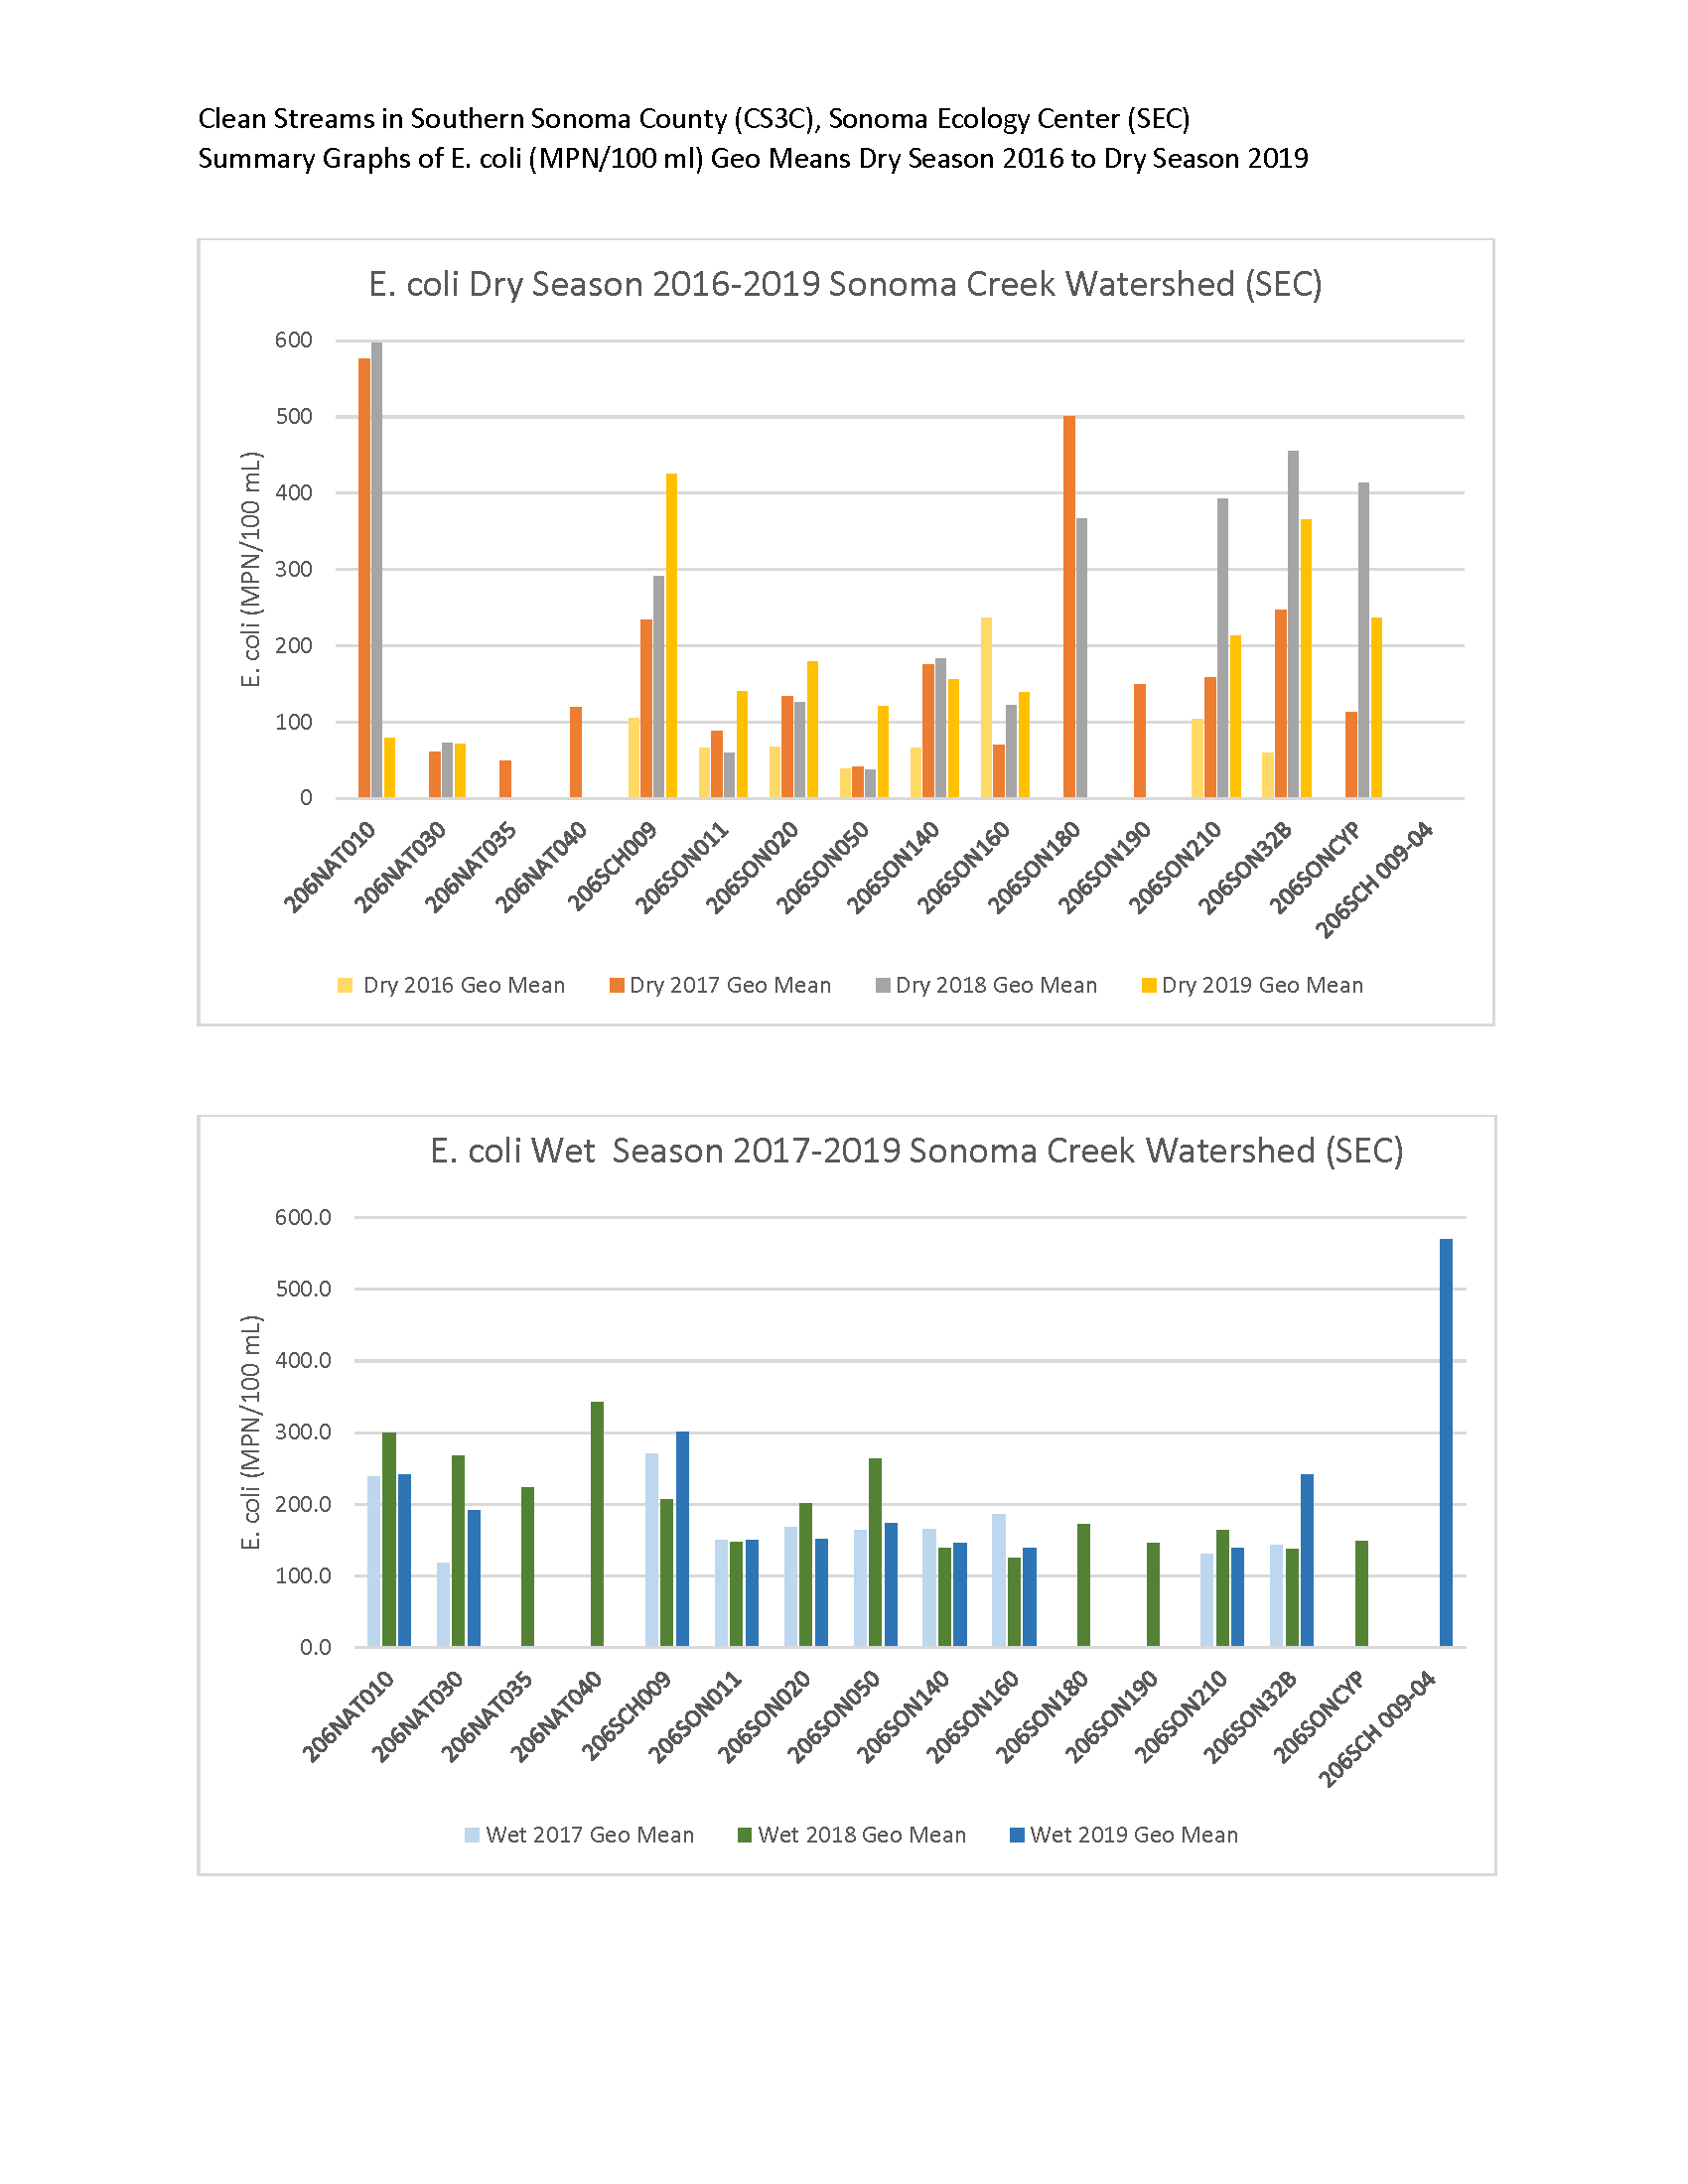
To obtain geomean pathogen data for the sites, samples are collected for five consecutive weeks at approximately the same time of day. Due to creek drying (dry season) and changing storm conditions or sample lab analysis results (wet season), some sites are not sampled for five weeks and therefore do not yield full geomeans.
Pesticide sampling occurs during the first-flush storm event (=> 0.5” of rain within 24 hours), often in November.
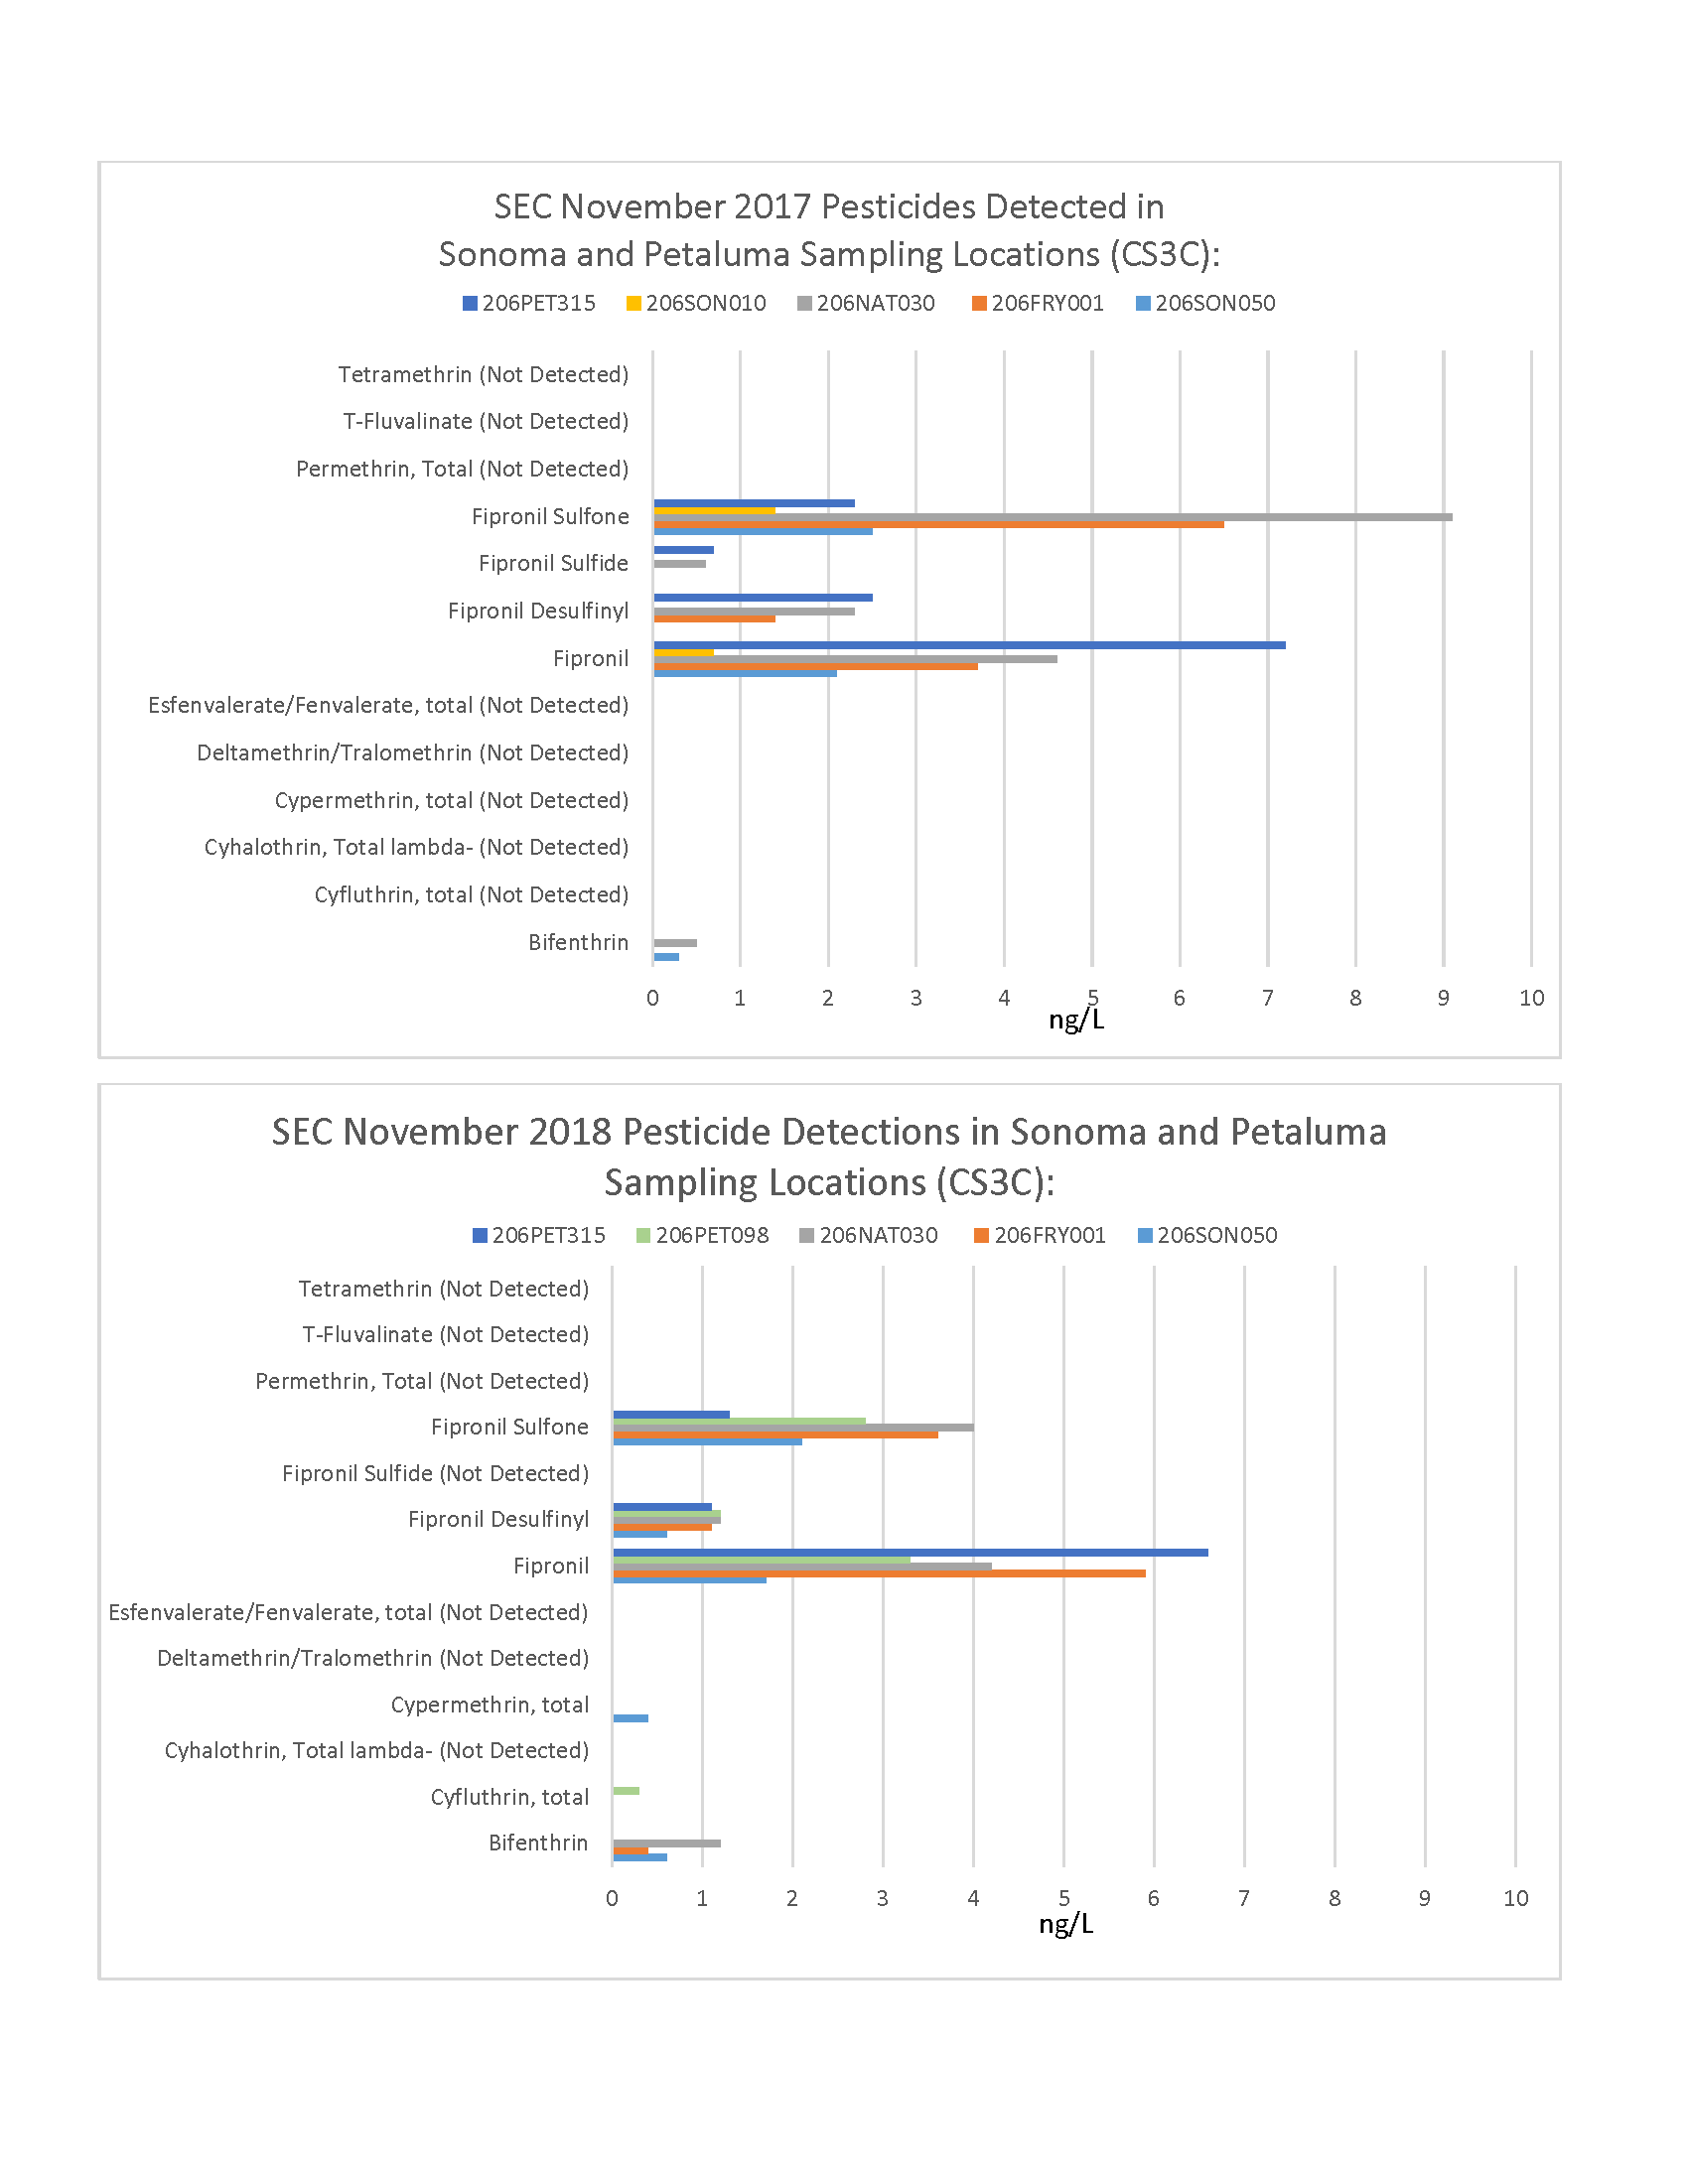


Links below are downloadable versions of the above summary data graphs and tables for pathogens (dry 2016 to dry season 2019) and pesticides (2017 and 2018) collected by the Sonoma Ecology Center:
SEC_CS3C_Pathogens_GeoMean_Graphs_Dry_2016_to_Dry_2019_20190927
SEC_CS3C_Pesticides_2017_vs_2018_Comparison_20190927
The entirety of this data, in raw form, is publicly available through the CEDEN (California Environmental Data Exchange Network) database: https://ceden.waterboards.ca.gov/AdvancedQueryTool
(CEDEN Search Hints: For this project, limit your search to Sonoma County and search for “Clean Streams in S. SoCo Pathogen Source Detection Monitoring Program.” From there, you have further choices to refine your data search.)